
S&P 500 index: how it started, how much it has grown and what it means in today’s crisis
When we talk about investment funds, S&P 500 is basically the “main character” of the traditional market.
Most global equity funds either track it directly or are benchmarked against it. For many small investors, especially outside the US, the first serious contact with traditional markets is through an S&P 500 ETF.
In this article we’ll look at:
- how the S&P 500 was created and what exactly it measures,
- how much it has really grown historically,
- how it behaved during major crises,
- what the current situation looks like (high rates, AI bubble, geopolitical tensions),
- and which reasonable scenarios we can imagine for the next five years – without fake promises.
1. What is the S&P 500 and how did it start?
The S&P 500 is an index that tracks around 500 of the largest US companies by market capitalization, listed on the NYSE and Nasdaq. In practice it covers about 80% of the total US stock market value, which is why it’s often used as a synonym for “the US market” as a whole.
A short history:
- 1957 – Standard & Poor’s launches the S&P 500 in the form we know today: an index of 500 large companies.
- The index was one of the first computer-based indices – calculated using then-revolutionary punch-card machines.
- 1976 – Vanguard launches the first index mutual fund for retail investors that passively tracks the S&P 500; this marks the start of mass index investing.
- Today, trillions of dollars are directly or indirectly tied to this index: via mutual funds, ETFs, pension funds and various derivatives.
Unlike the Dow Jones index (only 30 companies), the S&P 500 is a much broader picture of the economy – it includes technology, finance, healthcare, industry, consumer sectors and more.

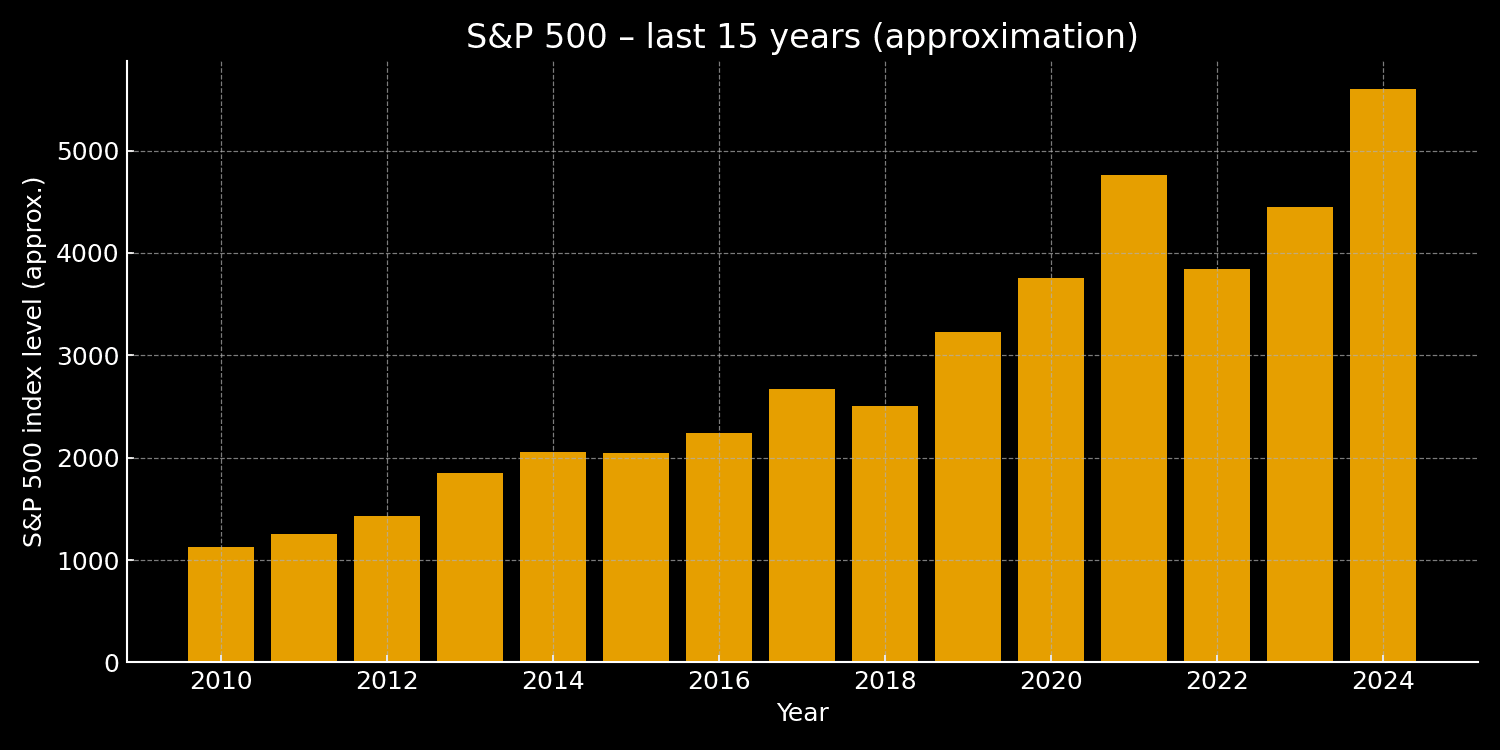
2. How much has the S&P 500 really grown?
The long-term numbers are brutal.
- Historically, the average annual return of the S&P 500 (with dividends reinvested) is about 9–10% nominally per year.
- After inflation, the real average is about 6–7% per year over long periods.
One illustrative example:
- If you had invested $100 at the beginning of 1928 in the S&P 500 and reinvested all dividends, by the end of 2025 you’d have more than $1.2 million – of course over “long decades” and with plenty of brutal drawdowns and crises along the way.
In more recent history (up to the end of October 2025):
- last 30 years – around ~10% per year nominal, ~7–8% real,
- last 20 years – around ~11% per year,
- last 10 years – even around ~14–15% per year, thanks to big tech and the AI wave.
But an important caveat: these averages are a mixture of very big up years and very bad down years. Examples of drawdowns:
- 2008 – financial crisis, S&P 500 total return about –37% for the year,
- 2022 – rate shock and inflation, drop of about –18%.
So the average return is not a promise, it’s a historical statistic which says:
over a long enough horizon, and if you’re willing to survive ugly phases, the S&P 500 has historically rewarded patience.
3. The S&P 500 through major crises
One reason why the S&P 500 is central in the story of investment funds is that the index has “survived the apocalypse” multiple times:
- Dot-com bust (2000–2002) – the internet bubble, NASDAQ more than halved; the S&P 500 spent several years in the red.
- Global financial crisis (2008–2009) – subprime meltdown, Lehman, the banking system on the edge of collapse, the index lost almost 40% in a single year.
- COVID crash (March 2020) – the fastest bear market in history, followed by an even faster recovery fueled by massive monetary and fiscal stimulus.
- Inflation shock and rate hikes (2022) – central banks hiked rates aggressively, and all risk assets suffered, including crypto.
The common pattern:
- Sharp drop (sometimes 30–40% or more).
- A phase of chaos, liquidations, narratives about “the end of capitalism”.
- Gradual recovery, often with a change in the index “winners” (sometimes oil, sometimes banks, sometimes tech, now AI).
For long-term funds that track the S&P 500, these crises are painful in the short term, but they’ve often been periods of the most attractive entry prices for investors with longer horizons.
4. What does the situation look like today (2024–2025)?
Late 2024 and 2025 are marked by a combination of:
- high and still unstable interest rates,
- AI mania – tech companies, especially those in AI/semis, are pulling the index upward,
- geopolitical tensions and cyclical weaknesses in Europe and China,
- new bouts of nervousness in the crypto and bond markets.
A few key points:
- After the 2022 drop, the S&P 500 rebounded strongly in 2023 and 2024 and entered 2025 near all-time highs.
- During 2024 and 2025 the index has posted double-digit returns, with new records around 6,800+ points before the latest corrections.
- Central banks (e.g. the Bank of England, but also others) openly warn that AI valuations may be overstretched and that there is a risk of a steeper decline if earnings fail to meet investors’ expectations.
- At the same time, occasional corrections in crypto and bonds send shockwaves through equity markets as well.
In other words:
we’re currently in a phase of a pricey but still bullish market, where a large part of the gains is concentrated in a relatively small number of mega-tech companies.
5. The S&P 500 and investment funds: how a regular investor gets in
For most people outside the US, buying all 500 stocks directly makes no sense. The practical entry point is via:
- index mutual funds (classic mutual funds that track the S&P 500),
- ETFs (exchange-traded funds) that replicate the index.
Historically:
- 1976 – Vanguard launches the first retail index fund tied to the S&P 500 – a huge leap forward for passive investing.
- In the 90s, the first S&P 500 ETFs arrive, making access even easier for everyday investors.
- Today there’s an entire army of S&P 500 ETFs (different providers, currencies, hedging options, dividend accumulation/distribution…).
Why funds on the S&P 500 are so popular:
- Broad diversification – 500 large companies from different sectors.
- Low costs – passive tracking is cheaper than active stock picking.
- Most actively managed funds struggle to consistently beat the S&P 500 over the long term (after fees).
For a reader coming from the crypto world, S&P 500 funds represent:
- the “core” of a traditional portfolio,
- something more stable than individual stocks and far more stable than crypto,
- but still a risky asset (it’s not savings, and not a guaranteed return).
6. What to do with the S&P 500 over the next 5 years? (scenarios, not prophecies)
Important to emphasize:
nobody knows exactly where the S&P 500 will be in 2030.
However, we can roughly outline scenarios, based on history and on projections from big houses (Deutsche Bank, J.P. Morgan, Capital Economics, etc.).
6.1. Optimistic scenario – “AI really delivers”
- Corporate earnings grow at a double-digit pace, not only in big tech but also in the “real economy”.
- Interest rates gradually move lower but stay high enough to keep inflation in check.
- AI proves to be a real productivity shock, not just a marketing story.
In such a world, it’s not impossible that:
- the index achieves an average return over the next 5 years close to its historical average (9–10% per year),
- the S&P 500 level at some point approaches or exceeds 8,000 points, as some analysts already forecast for 2026–2027.
6.2. Base scenario – “normalization and saturation”
- Earnings growth stabilizes, AI continues to bring benefits but not as spectacular as in the first phase.
- Rates stay higher than in the “zero-rate” era, so valuations cool off a bit.
- Geopolitical tensions keep creating occasional shocks.
The result:
- the market shows a mix of sideways movements and moderate growth,
- typical returns look more like 5–7% per year,
- multi-year periods with almost zero real return are not off the table.
6.3. Bearish scenario – “AI bubble + deeper recession”
- AI valuations burst (in central banks’ words: “too much optimism priced in”),
- a more serious recession hits the US or we see a broader global credit crunch,
- earnings fall, and the index posts a 30–40% drop or more before a recovery starts.
This scenario is not inevitable, but historically big corrections tend to happen roughly once every decade or two.
Any investor buying an S&P 500 fund must be aware that such a crash is not a bug, but a feature of equity markets.
7. How a small investor can approach S&P 500 funds sensibly
A few practical ideas (not advice, just food for thought):
-
Long term or nothing
The S&P 500 makes sense if you think in terms of 10+ years. If your horizon is 1–3 years, the risk of a serious loss is very real. -
Gradual investing (DCA)
Instead of going “all-in” in one day, many investors choose monthly or quarterly investing, to avoid the risk of entering exactly at a local top. -
Don’t mix savings and investing
S&P 500 funds are not a replacement for an emergency fund. Money you need in the next 6–12 months doesn’t go into the stock market. -
Diversification
The S&P 500 is already diversified within the US, but it’s often smart to combine it with:- global indices (world + emerging markets),
- potentially more defensive assets (bonds, cash, etc. – depending on risk profile).
-
Don’t compare it directly to crypto
Crypto can do +300% or –90% in a short period.
The S&P 500 is designed to be the backbone of long-term growth, not a casino ticket.
Conclusion
From 1957 until today, the S&P 500 has gone from the first serious computer-based index to the main reference point of global capitalism:
- it has delivered strong historical returns (around 9–10% per year nominal, 6–7% real),
- it has survived wars, inflation spikes, bubbles bursting and pandemics,
- it has become the foundation for an entire industry of index funds and ETFs.
In today’s mix of high rates, AI mania and geopolitical tensions, the S&P 500 looks both:
- attractive – as the historically most reliable “workhorse” of long-term investors,
- and risky – because valuations are stretched and a handful of mega-companies are pulling the index.
For the average investor, the key is not to guess the next top or bottom, but to focus on:
- a clear time horizon (10+ years),
- discipline (gradual investing, diversification),
- and accepting that even the best indices go through painful phases before the long-term math works out.
Disclaimer: This article is for informational purposes only and does not constitute financial, investment, tax, legal or any other form of professional advice. Always consult a licensed financial advisor before making investment decisions.